
2023 Atlantic hurricane season facts for kids
Quick facts for kids 2023 Atlantic hurricane season |
|
|---|---|

Season summary map
|
|
| Seasonal boundaries | |
| First system formed | Mid-January |
| Last system dissipated | Season ongoing |
| Seasonal statistics | |
| Total depressions | 4 |
| Total storms | 4 |
| Total fatalities | None |
| Total damage | Unknown |
| Related articles | |
|
|
The 2023 Atlantic hurricane season is the current hurricane season in the Atlantic Ocean in the Northern Hemisphere. It officially began on June 1, and will end on November 30. These dates, adopted by convention, historically describe the period in each year when most tropical cyclogenesis occurs in the Atlantic. However, the formation of subtropical or tropical cyclones is possible at any time of the year, as shown by the formation of an unnamed subtropical storm in mid-January, the earliest start of an Atlantic hurricane season since Hurricane Alex in 2016. Three named storms formed in June, tying the record for the most to develop in that month. Among them were tropical storms Bret and Cindy, which formed within a few days of each other, making this the first June in which two systems were active simultaneously since 1968.
Contents
Seasonal forecasts
| Source | Date | Named storms |
Hurricanes | Major hurricanes |
Ref |
| Average (1991–2020) | 14.4 | 7.2 | 3.2 | ||
| Record high activity | 30 | 15 | 7† | ||
| Record low activity | 4 | 2† | 0† | ||
|
|
|||||
| TSR | December 6, 2022 | 13 | 6 | 3 | |
| TSR | April 6, 2023 | 12 | 6 | 2 | |
| UA | April 7, 2023 | 19 | 9 | 5 | |
| CSU | April 13, 2023 | 13 | 6 | 2 | |
| TWC | April 13, 2023 | 15 | 7 | 3 | |
| NCSU | April 13, 2023 | 11–15 | 6–8 | 2–3 | |
| MU | April 27, 2023 | 15 | 7 | 3 | |
| UPenn | May 1, 2023 | 12–20 | N/A | N/A | |
| SMN | May 4, 2023 | 10–16 | 3–7 | 2–4 | |
| NOAA | May 25, 2023 | 12–17 | 5–9 | 1–4 | |
| UKMO* | May 26, 2023 | 20 | 11 | 5 | |
| TSR | May 31, 2023 | 13 | 6 | 2 | |
| CSU | June 1, 2023 | 15 | 7 | 3 | |
| UA | June 16, 2023 | 25 | 12 | 6 | |
| TWC | June 17, 2023 | 17 | 9 | 4 | |
|
|
|||||
| Actual activity | 4 | 0 | 0 | ||
| * June–November only † Most recent of several such occurrences. (See all) |
|||||
In advance of, and during, each hurricane season, several forecasts of hurricane activity are issued by national meteorological services, scientific agencies, and research groups. More than 25 forecasts were made for the 2023 Atlantic hurricane season. Among them were forecasts from the United States National Oceanic and Atmospheric Administration (NOAA)'s Climate Prediction Center, Mexico's Servicio Meteorológico Nacional (SMN), Tropical Storm Risk (TSR), the United Kingdom's Met Office (UKMO), and Philip J. Klotzbach, William M. Gray and their associates at Colorado State University (CSU). The forecasts include weekly and monthly changes in significant factors that help determine the number of tropical storms, hurricanes, and major hurricanes within a particular year. According to NOAA and CSU, the average Atlantic hurricane season between 1991 and 2020 contained roughly 14 tropical storms, seven hurricanes, three major hurricanes, and an accumulated cyclone energy (ACE) index of 74–126 units. Broadly speaking, ACE is a measure of the power of a tropical or subtropical storm multiplied by the length of time it existed. It is only calculated for full advisories on specific tropical and subtropical systems reaching or exceeding wind speeds of 39 mph (63 km/h). NOAA typically categorizes a season as above-average, average, or below-average based on the cumulative ACE index, but the number of tropical storms, hurricanes, and major hurricanes within a hurricane season is sometimes also considered.
Pre-season forecasts
On December 6, 2022, TSR released the first early prediction for the 2023 Atlantic season, predicting a slightly below average year with 13 named storms, 6 hurricanes, and 3 major hurricanes. Their updated prediction on April 6, 2023, called for a similar number of hurricanes, but reduced the number of named storms and major hurricanes by one. The following day, the University of Arizona (UA) posted their forecast calling for a very active season featuring 19 named storms, 9 hurricanes, 5 major hurricanes, and an ACE index of 163 units. On April 13, CSU researchers released their prediction calling for 13 named storms, 6 hurricanes, 2 major hurricanes, and an ACE index of 100 units. Also on April 13, TWC posted their forecast for 2023, calling for a near average season with 15 named storms, 7 hurricanes, and 3 major hurricanes. On April 27, University of Missouri (MU) issued their predictions of 10 named storms, 4 between categories one and two, and 3 major hurricanes. On May 1, University of Pennsylvania (UPenn) released their forecast for 12 to 20 named storms. On May 4, SMN issued its forecast for the Atlantic basin, anticipating 10 to 16 named storms overall, with 3 to 7 hurricanes, and 2 to 4 major hurricanes. On May 25, NOAA announced its forecast, calling for 12 to 17 named storms, 5 to 9 hurricanes, and 1 to 4 major hurricanes, with a 40% chance of a near-normal season and 30% each for an above-average season and a below-average season. One day later, UKMO issued its forecast calling for an extremely active season, with 20 named storms, 11 hurricanes, 5 major hurricanes, and an ACE index of 222 units.
In general, there was a wide range of conclusions among the groups making pre-season forecasts. With regard to number of hurricanes, projections ranged from 5 by SMN to 11 by UKMO. This reflected an uncertainty on the part of the various organizations about how the expected late-summer El Niño event and near record-warm warm sea surface temperatures would together impact tropical activity.
Mid-season forecasts
On June 1, the first official day of the season, CSU issued an updated forecast in which they raised their numbers slightly, now expecting a near-average season with 15 named storms, 7 hurricanes, 3 major hurricanes, and an ACE index of 125 units. They observed sea surface temperatures in the tropical and subtropical Atlantic had increased further to almost record-highs, which could offset increased wind shear from the impending El Niño. On June 16, UA updated its seasonal prediction, which indicates a very active hurricane season, with 25 named storms, 12 hurricanes, 6 major hurricanes, and an ACE index of 260 units.
Seasonal summary
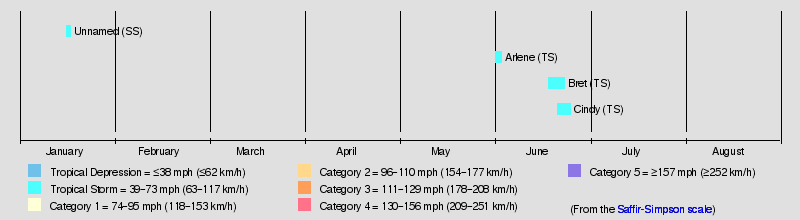

The 2023 Atlantic hurricane season officially began on June 1 and will end on November 30. Nonetheless, it unexpectedly commenced in mid-January, when a storm system, later determined to have been a subtropical storm, formed off the northeastern U.S. coast then moved over Atlantic Canada. Tropical Storm Arlene became the season's first named storm on June 2. Later that month, when Tropical Storm Bret and Tropical Storm Cindy formed, there were two Atlantic tropical cyclones active simultaneously in June for the first time since 1968. The two developed in the Main Development Region (MDR) from successive tropical waves coming off the coast of West Africa, with Bret becoming a tropical storm farther east in that region of the basin (42.2°W) than any storm on record so early in the calendar year. Their formation also marked the first time on record that two tropical storms have formed in the MDR during the month of June.
This season's ACE index as of 03:00 UTC on June 26, as calculated by Colorado State University using data from the NHC, is approximately 9.7 units. This number represents sum of the squares of the maximum sustained wind speed (knots) for all named storms while they are at least tropical storm intensity, divided by 10,000. Therefore, tropical depressions are not included.
Systems
Unnamed subtropical storm
| Subtropical storm (SSHS) | |||
|---|---|---|---|
|
|||
| Duration | Mid-January – (TBD) | ||
| Intensity | Winds unknown, Unknown | ||


On January 16, the National Hurricane Center (NHC) issued a special tropical weather outlook concerning a low-pressure area centered roughly 300 mi (480 km) north of Bermuda. The NHC noted that the low exhibited thunderstorm activity near its center but assessed its probability of transitioning into a tropical or subtropical cyclone as being near zero percent. These thunderstorms may have developed due to the combination of the cyclone's position over the Gulf Stream, where sea surface temperatures were around 68–70 °F (20–21 °C), and cold air aloft, resulting in high atmospheric instability. This tight cluster of storms was located within a broader storm system that brought snowfall to parts of coastal New England, including amounts of up to 4.5 in (11 cm) in portions of Massachusetts, and 3.5 in (8.9 cm) of snow in Boston. The disturbance brought wind gusts of near 100 km/h (62 mph) to Nova Scotia's Sable Island on the night of January 16, while moving northward toward the Cabot Strait. This prompted Environment Canada to issue wind warnings for parts of Nova Scotia and Newfoundland. The next day, it crossed over extreme eastern Nova Scotia as a weakening storm, before dissipating over the western coast of Newfoundland late that same day.
There was no storm-related damage reported. On May 11, following post-storm analysis, the NHC determined that 90L had been a subtropical storm, and was designated as the season's first storm.
Tropical Storm Arlene
| Tropical storm (SSHS) | |||
|---|---|---|---|
|
|||
| Duration | June 1 – June 3 | ||
| Intensity | 40 mph (65 km/h) (1-min), 998 mbar (hPa) | ||


On May 30, the NHC began monitoring an area of disturbed weather over the Gulf of Mexico for possible tropical development. An area of low pressure developed the following day. The system organized into Tropical Depression Two at 21:00 UTC on June 1, while located off the west coast of South Florida. Hurricane Hunters investigated the depression on the morning of June 2, and determined that it had strengthened into Tropical Storm Arlene. Wind shear and a dry atmosphere prevented the system from intensifying further as it drifted southward through the Gulf of Mexico. On June 3 at 15:00 UTC, Arlene weakened to a tropical depression, and degenerated into a remnant low shortly thereafter.
Tropical Storm Bret
| Tropical storm | |
  |
|
| Duration | June 19 – June 24 |
|---|---|
| Peak intensity | 70 mph (110 km/h) (1-min) 996 mbar (hPa) |
On June 15, the NHC began monitoring a tropical wave about to move off the coast of West Africa. The disturbance became better organized due to warm sea surface temperatures and favorable atmospheric conditions. On the morning of June 19, the system organized into Tropical Depression Three, and strengthened into Tropical Storm Bret later that day, about 1295 mi (2085 km) east of the southern Windward Islands. Gradual intensification occurred during the next couple of days as it headed west towards the Lesser Antilles. Hurricane Hunters investigated Bret early on June 22 and found sustained winds of 70 mph (110 km/h) and a central pressure of 996 mbar (29.4 inHg). Soon after, Bret moved into an area of increased vertical wind shear, causing it to gradually weaken as it moved across the Lesser Antilles. Overnight on June 22–23, it passed just north of Barbados and directly over St. Vincent. Next, during the early hours of June 24, Bret passed just to the north of Aruba as a weakening storm with only minimal convection occurring near its center, and opened into a trough later that day, near the Guajira Peninsula of Colombia.
Bret brought gusty winds and heavy rains to the Windward Islands, with its center passing just north of Barbados and directly over St. Vincent. More than 120 residents in Saint Vincent and the Grenadines sought refuge in shelters as evacuations occurred near the coastline. The storm damaged or destroyed several homes there. Hewanorra International Airport on Saint Lucia reported a wind gust of 69 mph (111 km/h) at 05:00 UTC on June 23; and official reported that much of the island's electrical grid had been knocked out by the storm.
Tropical Storm Cindy
| Tropical storm | |
  |
|
| Duration | June 22 – June 26 |
|---|---|
| Peak intensity | 60 mph (95 km/h) (1-min) 1001 mbar (hPa) |
On June 18, the NHC began tracking a tropical wave that had recently moved off the coast of West Africa, which became more organized the next day. Though the system initially struggled to become better organized, it was in an environment overall conducive to development, and organized into Tropical Depression Four on the morning of June 22, while about 1,395 mi (2,240 km) east of the Lesser Antilles. Despite marginal atmospheric conditions, the depression strengthened into Tropical Storm Cindy early the next day. On the morning of June 24, Cindy's sustained winds intensified to 60 mph (97 km/h). But later that day and continuing into the next, the storm grew progressively weaker. Then, at 03:00 UTC on June 26, Cindy degenerated into a tropical wave about 375 mi (604 km) north-northeast of the Northern Leeward Islands. Even so, the NHC continued to monitor the remnants into the next day due to there being a potential for redevelopment.
Storm names
The following list of names will be used for named storms that form in the North Atlantic in 2023. This is the same list used in the 2017 season, with the exceptions of Harold, Idalia, Margot, and Nigel, which replaced Harvey, Irma, Maria, and Nate, respectively. Retired names, if any, will be announced by the World Meteorological Organization in the spring of 2024. The names not retired from this list will be used again in the 2029 season.
|
|
|
Season effects
This is a table of all of the storms that have formed in the 2023 Atlantic hurricane season. It includes their duration, names, intensities, areas affected, damages, and death totals. Deaths in parentheses are additional and indirect (an example of an indirect death would be a traffic accident), but were still related to that storm. Damage and deaths include totals while the storm was extratropical, a wave, or a low, and all of the damage figures are in 2023 USD.
| Saffir–Simpson Hurricane Scale | ||||||
| TD | TS | C1 | C2 | C3 | C4 | C5 |
| Storm name |
Dates active | Storm category
at peak intensity |
Max 1-min wind mph (km/h) |
Min. press. (mbar) |
Areas affected | Damage (USD) |
Deaths | Refs
|
||
|---|---|---|---|---|---|---|---|---|---|---|
| Unnamed | Mid-January | Subtropical storm | TBD | TBD | New England, Atlantic Canada | None | None | |||
| Arlene | June 1–3 | Tropical storm | 40 (65) | 998 | Florida | None | None | |||
| Bret | June 19–24 | Tropical storm | 70 (110) | 996 | Windward Islands, Leeward Antilles, Northern Venezuela, Northeastern Colombia | Minimal | None | |||
| Cindy | June 22–26 | Tropical storm | 60 (95) | 1001 | None | None | None | |||
| Season Aggregates | ||||||||||
| 4 systems | Mid-January – Season ongoing | – | – | Minimal | None | |||||
See also
 In Spanish: Temporada de huracanes en el Atlántico de 2023 para niños
- Weather of 2023
- Tropical cyclones in 2023
- 2023 Pacific hurricane season
- 2023 Pacific typhoon season
- 2023 North Indian Ocean cyclone season
- South-West Indian Ocean cyclone seasons: 2022–23, 2023–24
- Australian region cyclone seasons: 2022–23, 2023–24
- South Pacific cyclone seasons: 2022–23, 2023–24
